

Summer People Analytics Challenge from Orgnostics
While scrolling through TikTok one of the people I follow, Trena of Diggin into Data, showcased a challenge being hosted by Orgnostics about People Analytics. After following a few HR Technologies on LinkedIn, I began to develop a strong interest in HR and People Analytics and how data can help employees and companies alike. So naturally this challenge was right up my alley! I wanted to get a taste of what it would be like to work with HR data and create a project around People Analytics.
(To learn more about the Summer People Analytics Challenge you can visit here)
The Challenge:
Orgnostics offered up three different challenges that we could take:
- Tackle High Attrition
- Tackle High Growth
- Tackle Absenteeism
I decided to take on the High Attrition challenge as I found that problem the most interesting: why were employees leaving the company and did that have an effect on the NPS (net promoter score) dropping?
We had three ways of analyzing the data:
- Using our own HR company data within the Orgnostic platform
- Using dummy data within the Orgnostic platform
- Using dummy data stored in Excel or CSV files
Since I’m continuing to practice my data analytics skills through the whole data analytics lifecycle, I decided to use the Excel dummy data to tackle the challenge. While I chose this option, I do have to say that I spent some time exploring the Orgnostic platform and thought it was a really intuitive tool that showcased a lot of different metrics in their dashboards with visualizations you could manipulate and filter. If I had more time, I would have gone back to try out one of the other challenges using the platform.
Before digging into the data there were three questions I wanted to solve for:
- Is employee attrition within the Customer Experience department affecting the support given to clients?
- What are the main reasons employees are leaving?
- How can we retain more employees within the Customer Experience department to keep a higher rate of internal knowledge?
The Process
When I looked through the Excel sheets I found I had data on employee hire and leave dates, how employees were hired (Indeed, Referral, etc.), employee leave time (vacation, sick time taken etc.), and exit survey responses from former employees.
I went through the Excel sheets like I’ve learned to do: looking for any duplications, missing data or format errors. The dataset Orgnostics provided was actually pretty clean as I didn’t find any duplications, errors or incomplete data.
After I finished my cleaning process, I narrowed down the metrics I wanted to look at to answer my business questions:
- How many employees left the company and then how many specifically within the Customer Experience department?
- How long were employees with the company before they left?
- What were the top reasons for leaving the company?
- How did this compare to the company overall?
After narrowing down my metrics and comparing them to my business task, I realized I may not have all the data I would need to fully answer my business questions. I realized I didn’t have any employee performance metrics or customer survey data. This information would have been more helpful in drawing correlations and digging in deeper to find the answers I sought.
Another thing missing that came up in the feedback zoom call I attended with others working on this challenge was financial data. Both within the Excel dataset and the Orgnostic platform there was no financial data that could be connected to the HR data. So that also caused a limited scope for answering and solving the business problem set forth to participants of the challenge.
Analysis & Findings
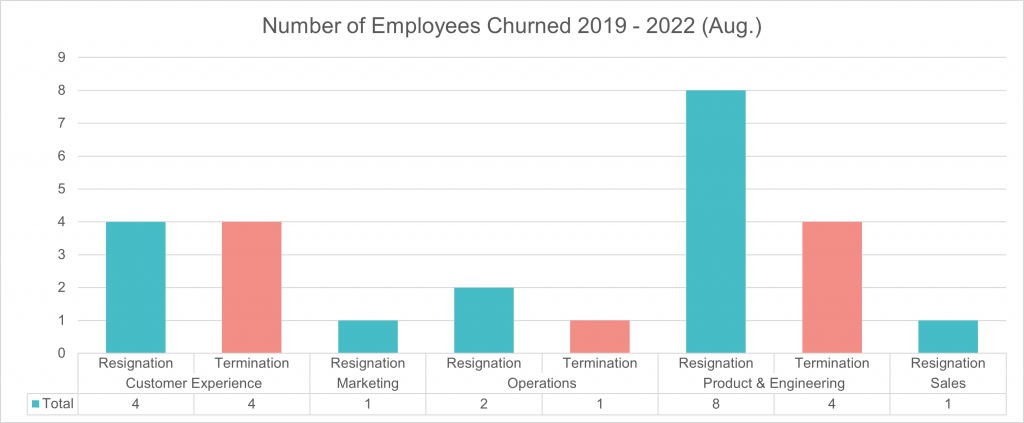
In order to answer my questions, I worked within Excel to figure out how many employees were in each department and then within each department how many people left the company. I utilized the COUNT function for this task. Then I did simple math to find the percentage of employees that left within each department.
I found that 29% of employees within the Customer Experience department left the company within the 2.5-year time period (2019-2022). Within that 29%, half of the employees left voluntarily. While Product & Engineering had the most employees leave their department (12 employees); since their department was so large it only equaled about 10%. When I looked at the company overall, I found the attrition rate to be 12%. This indicated to me that the Customer Experience department was experience a much higher attrition rate than other departments within the company.
After looking at rate of employee attrition, I wanted to figure out how much potential internal knowledge employees had within our company. I evaluated how many months each employee worked at the company by utilizing the DATEDIF function and assigning those employees who haven’t left a “present day” or TODAY() function date in order to calculate how long they were working for the company.
I found that employees within the Customer Experience department were only with the company for an average of 9 months before they left either voluntarily or involuntarily. Looking company wide, I found the average employee has only been with the company for 14 months. Again, this led me to believe that there was an internal knowledge issue within the Customer Experience department and even within the company as a whole.
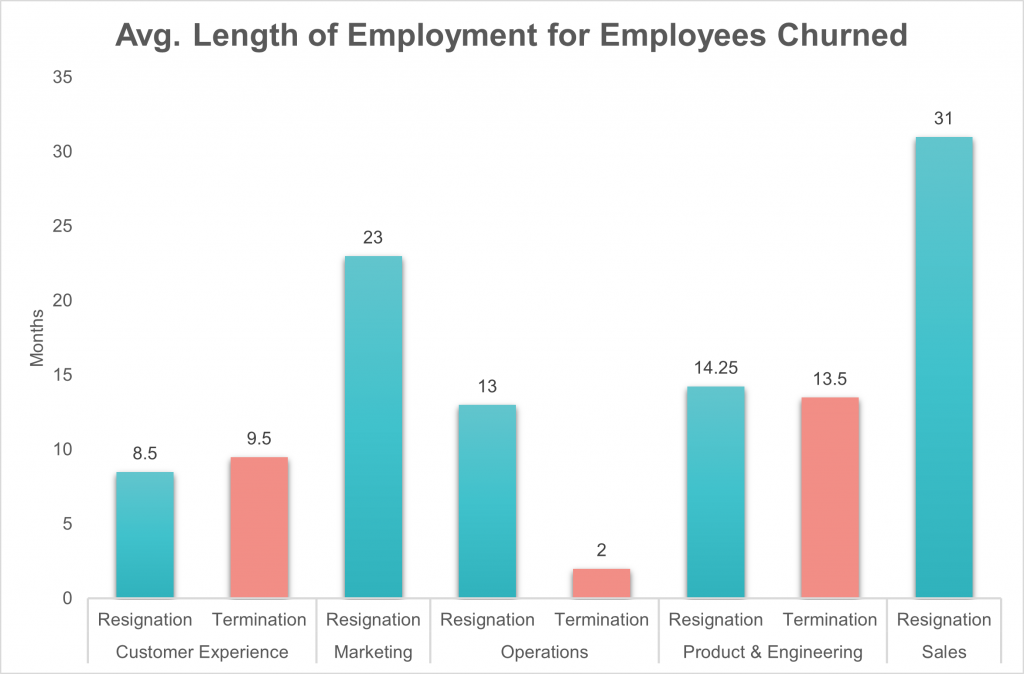
Both the rate of attrition and average length of time with the company seemed to indicate to me that there may be a Talent Acquisition issue within the company.
After working through that data, I decided to look at the reasons employees were leaving. I utilized the COUNTIF function within Excel to figure out how many of the 16 employees who provided an exit survey responded to each question with one of the 6 responses:
- Gain a lot
- Gain a little
- Neither lose nor gain
- Lose a little
- No Answer
I then combined the number of times someone responded with ‘gain a lot’ with the number of times someone responded with ‘gain a little’ to see which of the reasons people were leaving had the highest total ‘gained’ responses. I utilized the basic SUM function for this task. I found that the highest reasons that employees were leaving voluntarily was because their new job offered more long-term career growth opportunities and they offered higher compensation with long-term compensation growth opportunities.
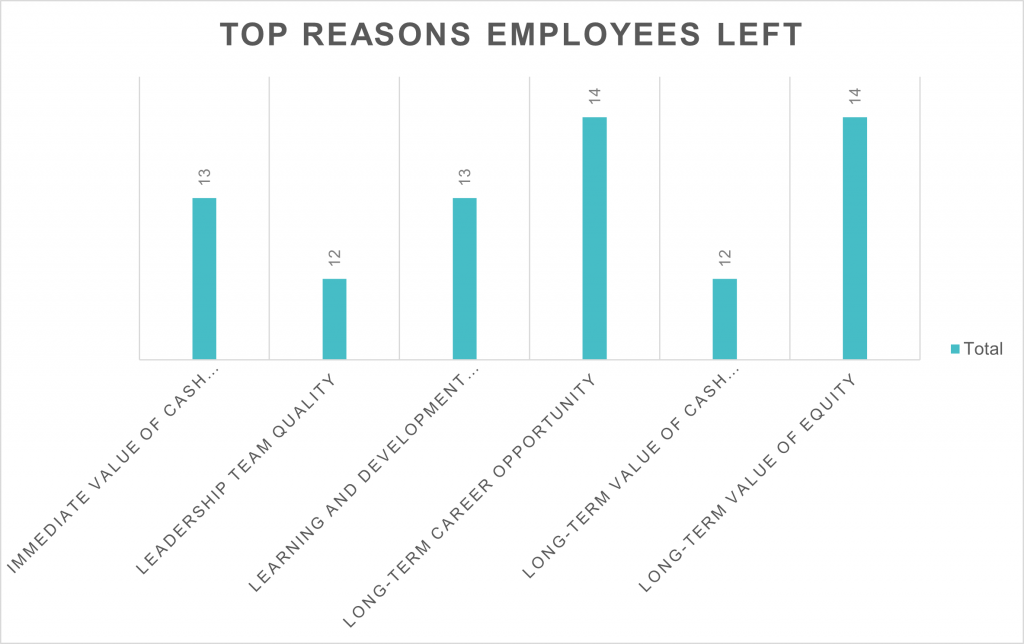
This led me to conclude that our company wasn’t offering enough or correct employee development and training opportunities and that our compensation offer package might not be competitive enough to retain or gain new employees.
Action Points
After my analysis and findings, I needed to recommend some action points to the executives of the company.
My biggest takeaway from this was that we needed more data to get a fuller picture of what was happening within the Customer Experience department of the company.
With that said, there were a few action points or next steps I wanted to recommend:
- Evaluate the talent acquisition process
- Work with each department to determine top qualifications for each role.
- Evaluate the hiring process and determine best practices for acquiring new talent.
- Determine competitive salary rates and compare to current offer packages.
- Determine any additional training needed for the talent acquisition team.
- Evaluate and develop a more robust employee and development program.
- Work with each department to streamline onboarding process so that each new employee is equipped with priority internal knowledge for their role as quickly as possible.
- Determine long-term career development goals for each department and respective employees
- What career development opportunities are available to new employees and current ones?
- How can employees get access to trainings and skill development?
- Develop (or adjust) a monthly review process for determining gaps in internal knowledge or skill set & create action plans for addressing the results found. (once employees are more established move review process to quarterly)
- Evaluate company and department communication around employee growth & development as well as company culture and benefits.
- How are we communicating to our employees & prospective employees about career growth & benefits of working within our company?
- Work with stakeholders to determine additional reasons for the drop in the NPS rate.
- Besides attrition rate, what other aspects of the Customer Experience department may be causing the drop in the NPS rate?
- Evaluate escalation process to see if there is a potential breakdown in the workflow.
- Evaluate schedules in comparison to rate of call inflow & queue rates.
- Besides attrition rate, what other aspects of the Customer Experience department may be causing the drop in the NPS rate?
Final Thoughts
This challenge was great practice for me and really inflamed my interest in HR and People Analytics. I’ve already started researching other datasets that are free and similar to this topic for me to explore and work with. I’ve also been exploring webinars, articles and any free training I can find about HR and People Analytics. If you know of any, please drop links below!
While this dataset was small, clean and set up with a clear objective and answer to be found at the end, I still felt like it was worth exploring and using for practicing my data analytics skills. After reading through some other participants’ projects and listening during the feedback zoom call I attended, I’ve realized that I still have a lot to learn when it comes to data analysis and People Analytics. While I have the basics and the workflow down, I need to work on deepening my thought process on what metrics I need to look at and which ones I don’t need to use. For example, it probably would have been helpful to look at how long it took to on-board a new employee to see if there were any long delays and if so, if that was causing a higher attrition rate.
Overall though, I enjoyed this challenge, working with data outside of the Google Data Analytics Certificate program, and getting a taste for People Analytics. I can’t wait to delve into more about People Analytics and share more analytics projects with you all as I do so!
If you’d like to see my final power point presentation you can do so here.
– Nicole